Chargement…

Four complementary analysis modes
Four complementary analysis modes
Accounting mode: net amount, detailed fees, pie chart
Business mode: net profit per SKU, return rate
Cashflow mode: next deposit, payment history
Combined mode: inventory + sales, coverage days, alerts
Import CSV, TSV, TXT files directly from Seller Central

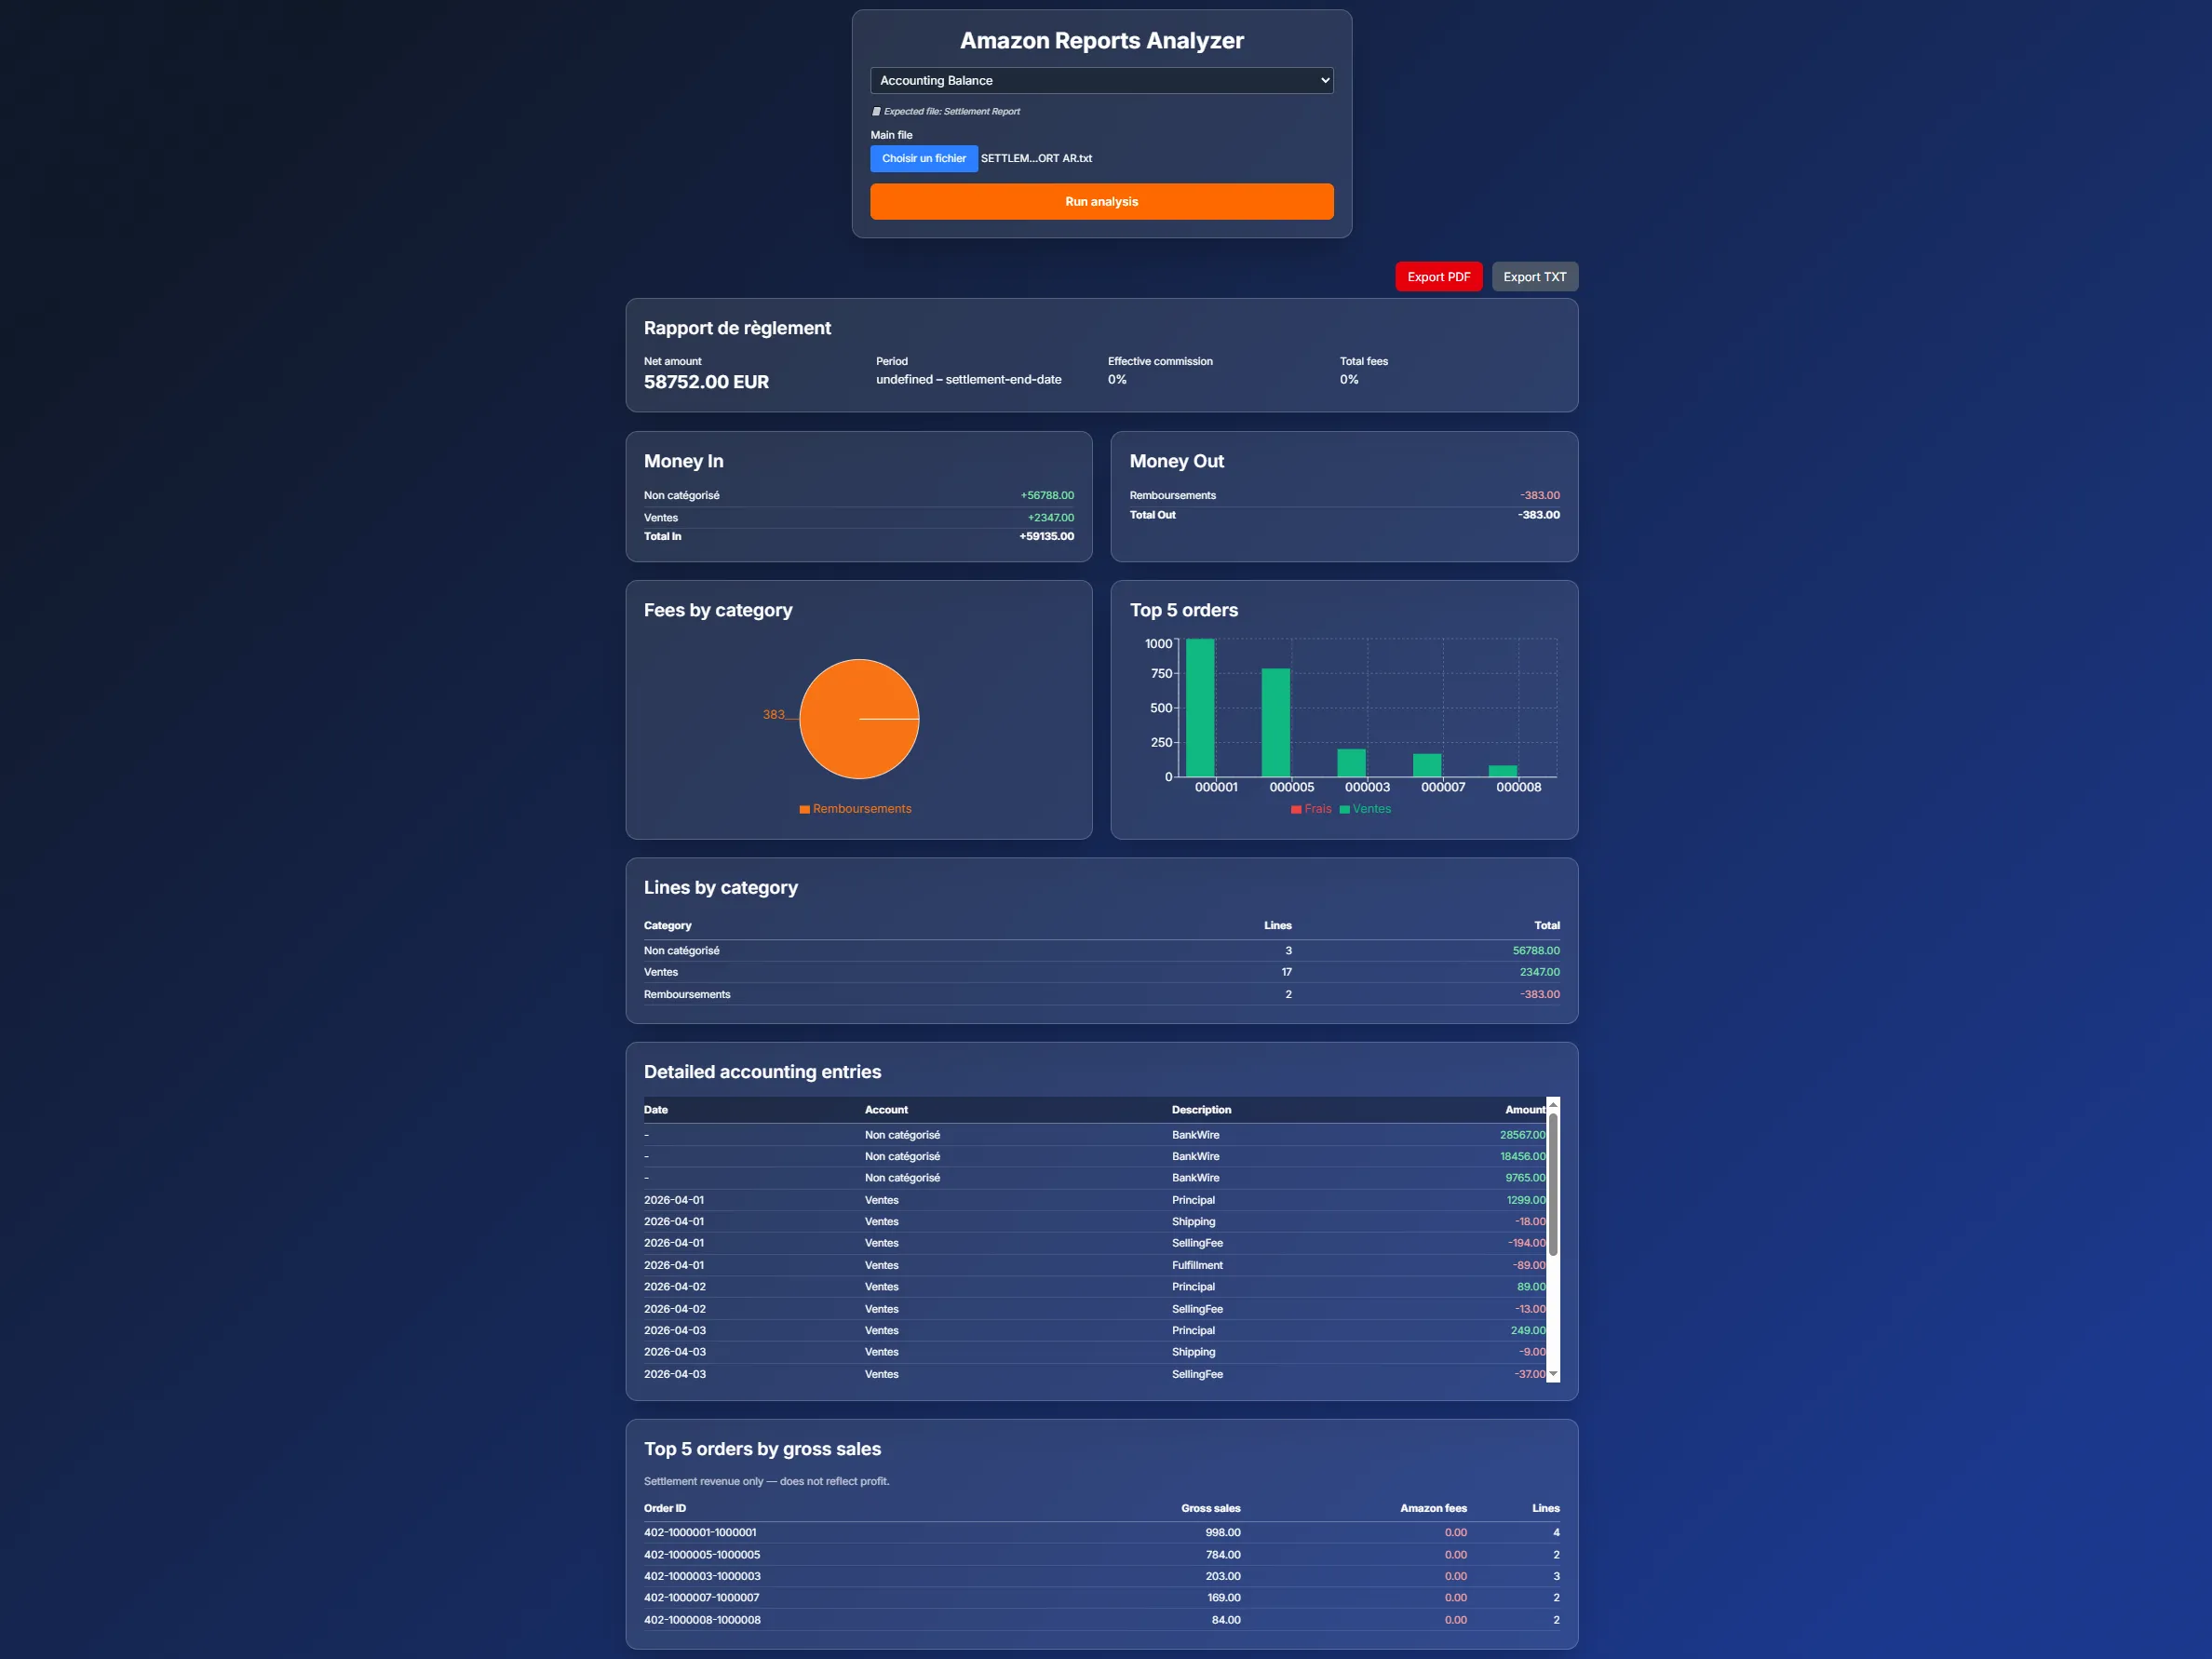
Professional charts and exports
Professional charts and exports
Recharts charts: fee pie, top orders bars
Multi‑page PDF export, ready for your accountant
TXT (JSON) export for integration into other tools
Automatic calculation of return rate, TACoS, coverage days
Glassmorphism UI, toast notifications
Key Features
Multiple modes
Accounting, Business, Cashflow, Combined – one mode per need.
Interactive charts
Pie, bar, line – visualize what matters.
PDF export
Paginated report with summary, tables and charts.
SKU analysis
Net profit, return rate, revenue contribution.
Stock alerts
Coverage days, imminent stockout, recommendations.
Multi‑file support
CSV, TSV, TXT – import your Amazon reports without conversion.
Why use Seller Reports?
SELLER REPORTS – Turn your raw data into strategic decisions.
Amazon reports contain a wealth of information about your business, but reading them takes considerable time. Sellers spend an average of 4 hours per week compiling and analyzing their CSV files, often without extracting the essentials. Seller Reports automates this thankless task. It reads your sales, settlement and inventory reports, then generates clear dashboards, dynamic charts and PDF exports ready to share with your accountant in seconds. You no longer waste time deciphering columns of numbers: you get a synthetic view of your profitability, cash flow and inventory status directly.
Four complementary analysis modes.
Every seller has different needs. Seller Reports offers four analysis modes, activated with a single click. The Accounting mode details each fee (commission, FBA, storage) and presents a pie chart of expenses to identify the items that weigh most on your margin. The Business mode calculates net profit per SKU, refund rate and each reference's contribution to your revenue, helping you isolate products that perform and those that cost you money. The Cash Flow mode anticipates your next Amazon disbursements and traces the history of your receipts, avoiding end-of-month surprises. Finally, the Combined mode cross-references your sales with your inventory to calculate your days of cover and trigger restocking alerts: you no longer suffer from stockouts.
Professional charts and exports.
Seller Reports doesn't just display numbers. It showcases them with Recharts charts: fee pie chart, top orders bar chart, profit per SKU, stock coverage. You immediately visualize what matters. The module also generates a multi-page paginated PDF report, formatted and ready to send directly to your accountant. For those who want to integrate data into other tools, a TXT (JSON) export is also available. The clear and responsive glassmorphism interface makes analysis almost enjoyable, even for non-number-crunchers.
Concrete answers to everyday questions.
How many products do I need to restock to last four weeks? Which SKU has the highest return rate? When is my next Amazon disbursement? Seller Reports answers these questions in seconds, without entering an Excel formula. The module automatically calculates your stock coverage rate, identifies imminent stockouts and flags references whose Amazon fees exceed the norm. You move from retrospective observation to proactive management, with actionable recommendations based on your own data.
Key market figures
4 hours
spent each week by sellers compiling their Amazon reports
30-40%
of the selling price absorbed by Amazon fees before profit
8-15%
Amazon commission rate depending on the category
x3 to x4
increase in storage fees in Q4 compared to the standard rate
12-15%
average conversion rate of a well-optimized listing
1 in 3
sellers has seen their margin reduced by hidden fees
Frequently asked questions
How to analyze Amazon Seller reports without spending hours on Excel?
With Seller Reports, import your CSV files and get clear dashboards, charts and a PDF export ready for your accountant in seconds.
What are the most impactful Amazon fees on margin?
Commissions (8-15%), FBA fees and storage (especially in Q4) weigh heavily. Seller Reports' Accounting mode details them and visualizes them in a pie chart.
How to calculate profitability per SKU on Amazon?
The Business mode calculates net profit, refund rate and revenue contribution for each SKU, helping you identify profitable products.
What are days of inventory cover and why are they important?
They indicate how long your stock can last. Too low = risk of stockout; too high = overstock. Seller Reports calculates them automatically.
How to anticipate an Amazon disbursement to manage cash flow?
The Cash Flow mode analyzes your settlement reports to give you the next disbursement and the history of your receipts.
Can I export an accounting report for my accountant from Amazon?
Yes, Seller Reports generates a paginated PDF with summary, tables and charts, structured for your accountant.
Why is my refund rate high and how to reduce it?
A high rate may signal quality or description issues. Seller Reports' Business mode calculates it per SKU to target corrective actions.
Is it possible to merge a sales report and an inventory for a complete view?
Yes, the Combined mode cross-references sales and inventory to calculate days of cover and trigger restocking alerts.
Ready to say goodbye to endless Excel sheets?
With Seller Reports, your Amazon data becomes a clear and actionable dashboard.